July numbers are in. Here’s what they mean as we move through August.
Orange County is still a seller’s market heading into late summer—but the gap between single-family homes and condos/townhomes is widening, inventory is climbing, and higher mortgage rates are slowing the pace of deals.
If you’re buying or selling in Irvine, Newport Beach, Huntington Beach, Mission Viejo, or anywhere in Orange County, July’s numbers look familiar on the surface: limited supply, homes still selling close to list, and prices that haven’t collapsed. Dig one layer deeper and the story changes. Active listings rose, new pendings dropped, sold prices slipped month-over-month, and days on market stretched. That’s not a crash. It’s a seasonal and rate-driven cooling after a strong first half of the year—and it’s the backdrop for August decisions.
Here’s the balanced look at July activity, split by property type, plus what mortgage rates are doing to demand right now.
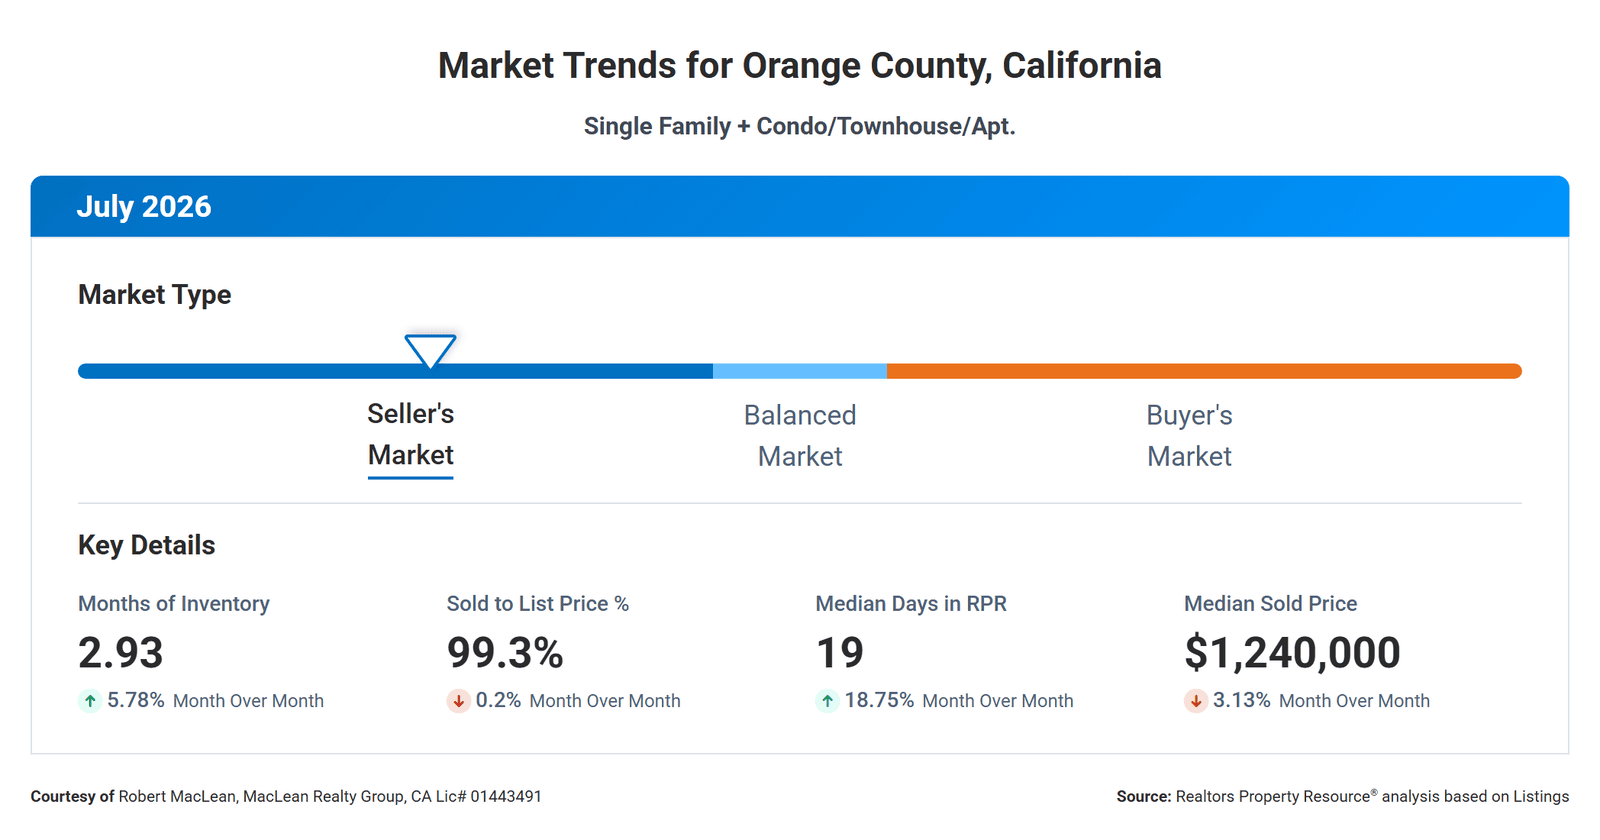
July 2026 Snapshot (Single Family + Condo/Townhouse/Apt.)
- Median sold price: $1,240,000 (down 3.1% month-over-month)
- Active listings: 4,956 (up 4.2% MoM)
- Months of inventory: 2.93 (up 5.8% MoM, but still down 11.2% year-over-year)
- Sold-to-list ratio: 99.3%
- Median days on market (sold): 19 (up sharply from June)
- Market type: Seller’s market
Estimated median property value sat at $1,232,630 — up 0.5% from June and +2% over 12 months. Values are still grinding higher even as transaction volume and list prices ease.
Single-Family Residences: Still the Tighter, Stronger Segment
Single-family homes remain the healthiest part of the Orange County market.
- Median list price on actives: $1,795,000 (essentially flat, –0.2% MoM)
- Active inventory: 2,939 (+3.1% MoM)
- Months of supply: 2.65
- Median sold price: $1,450,000 (–1.2% MoM)
- Sold-to-list: 99.5%
- Median days on market for sold homes: 17
- New listings: 1,806 (+2.1%)
- New pendings: 1,086 (–10% MoM)
SFR inventory is rising, but from a very low base. Year-over-year months of supply is still down nearly 17%. Homes that are priced correctly and show well are still moving in two to three weeks. Buyers have a little more room than they did in spring, but multiple-offer situations haven’t disappeared in the best neighborhoods and school districts.
Estimated median SFR value: $1,348,070 (+0.4% last month, +2.2% year-over-year). The long-term chart still shows Orange County single-family homes pulling away from both California and national averages.
What changed in July: The spring rush is over. New pendings and pending inventory both dropped double-digits. That’s typical mid-summer behavior plus the effect of rates moving higher through the month. Sellers who listed at aggressive spring prices are starting to see more negotiation—and that dynamic is carrying into August.
Condos, Townhomes & Apartments: More Inventory, More Leverage for Buyers
The attached market is loosening faster.
- Median list price on actives: $832,000 (+0.5% MoM)
- Active inventory: 2,016 (+5.8% MoM)
- Months of supply: 3.45
- Median sold price: $792,000 (–2.4% MoM)
- Sold-to-list: 99%
- Median days on market for sold homes: 25
- New listings: 1,054 (+5.6%)
- New pendings: 538 (–15.9% MoM)
Condos and townhomes now sit closer to balanced territory. Inventory is building, pendings fell harder than in the SFR segment, and estimated values were flat last month and down 0.9% over 12 months ($826,870). That’s the first clear sign that the attached market is absorbing more of the rate and affordability pressure.
HOA dues, insurance costs, and the fact that many condo buyers are more rate-sensitive all show up here. Well-located, updated units in Irvine, Costa Mesa, and Huntington Beach still sell. Older or high-HOA products are sitting longer and seeing price reductions.
Mortgage Rates: The Headwind That Carried Into August
30-year fixed rates started July in the mid-6.4% range and finished the month near 6.66%—the highest level in about a year.
Freddie Mac’s weekly survey showed the climb: 6.43% (July 2) → 6.49% → 6.55% → 6.58% → 6.66% (July 30). Through mid-to-late August they’ve only eased slightly, holding in the mid-6.6% area (around 6.65% as of the August 20 survey).
Every 0.25% increase in rate reduces purchasing power. On a $1.4 million loan, the difference between 6.4% and 6.7% is real money every month. That showed up directly in July’s data: fewer new pendings, longer days on market, and sold prices that slipped even while list prices held relatively firm.
Rates are not collapsing in the second half of 2026. Most forecasts still see them in the mid-6% range through year-end. That means the “wait for 5% mortgages” strategy is likely to keep some buyers on the sidelines while others who need to move simply adjust their price point or location.
Where the Market Appears to Be Heading
Orange County is not flipping to a buyer’s market. 2.65–2.93 months of supply is still seller-favored. But the direction of travel is clear:
- Inventory is rising from historically tight levels.
- The attached market is loosening first.
- Price growth has slowed to low-single digits (or gone slightly negative month-over-month).
- Days on market are stretching, especially for homes that miss on price or condition.
- Transaction volume is softer than the first half of the year.
This looks like a classic late-summer slowdown amplified by rates that refused to drop. If inventory keeps climbing through August and September and rates stay above 6.5%, expect more price reductions, more concessions, and a market that rewards well-prepared buyers and realistically priced sellers.
The long-term charts still favor Orange County. Median estimated values remain well above California and U.S. averages, and year-over-year supply is still lower than last summer. Demand hasn’t vanished—it’s just more selective.
What This Means If You’re Buying or Selling in August
Sellers of single-family homes: You still have an edge, especially if your home is updated and in a strong school area. Price it to the current market, not last April. Overpricing now just adds days on market.
Sellers of condos/townhomes: You have more competition. Condition, HOA health, and price will decide whether you get an offer in 3 weeks or 6–8 weeks.
Buyers: You have more choices than you did in May. Use the extra inventory and longer market times. Get fully underwritten, know your max payment at current rates, and be ready to move on the right property. The best homes still don’t linger.
Orange County real estate as of this August update is a tale of two product types sharing the same zip codes. Single-family homes are holding value and selling closer to asking. Condos and townhomes are giving buyers more breathing room. Rates are the common variable that’s slowing everyone down.
If you want the charts broken down for your specific city or price range, or you’re trying to decide whether to list this fall or wait, reach out. Data is only useful when it’s applied to your actual property and timeline.
Common questions people ask right now
Is Orange County still a seller’s market in August 2026?
Yes for single-family homes (2.65 months of inventory based on July data). Condos are closer to balanced at 3.45 months.
Are home prices dropping in Orange County?
Month-over-month sold prices slipped in July. Year-over-year estimated values are still modestly positive for houses and slightly negative for condos.
How are mortgage rates affecting OC buyers?
Rates in the mid-6.6% range in late July—and still there in August—reduced purchasing power and cut new pending activity, especially in the attached segment.