As we move into spring 2026, the Orange County housing market continues to show resilience and competitiveness. If you're searching for "Orange County real estate trends March 2026" or "median home prices in Orange County CA," this report breaks down the latest real estate data. We'll analyze key metrics like inventory levels, sales volume, days on market, and more, while also incorporating current mortgage rates to help buyers and sellers make informed decisions. Whether you're a first-time homebuyer, investor, or seller in Orange County or the surrounding counties, this update provides actionable insights into the seller's market dynamics.
Key Housing Market Metrics for Orange County in February 2026
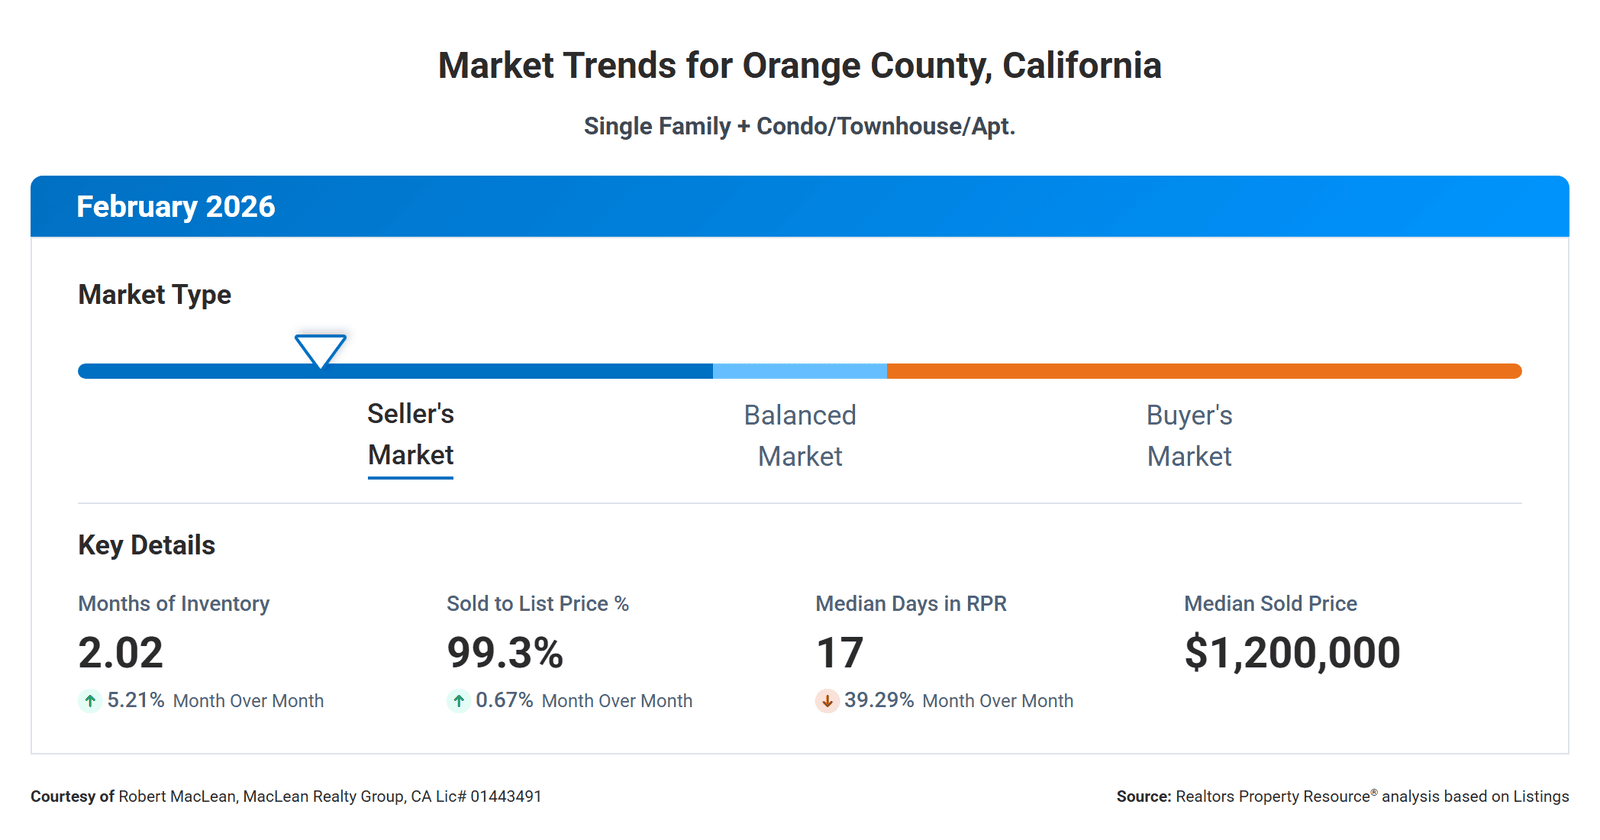
The data reveals a robust seller's market, with low inventory and quick sales driving the pace. Here's a summary of the core indicators:
| Metric | February 2026 Value | Month-over-Month Change | Key Insight |
|---|---|---|---|
| Active Listings (# of Properties) | 3,461 | +5.3% | Inventory is ticking up slightly but remains tight, contributing to competitive bidding. |
| New Listings (# of Properties) | 2,421 | +3.4% | A modest increase in new properties entering the market, potentially easing some pressure in the coming months. |
| Sold Listings (# of Properties) | 1,306 | +12.8% | Sales volume surged, indicating strong buyer demand despite high prices. |
| Median Sold Price | $1,200,000 | 0% | Prices held steady, showing stability in a high-value market where the median home price in Orange County remains elevated. |
| Sold to List Price Ratio | 99.31% | +0.7% | Homes are selling very close to asking price, a sign of limited negotiation room for buyers. |
| Median Days on Market (Sold Listings) | 17 days | -39.3% | Properties are moving faster than ever, with median days dropping — ideal for sellers aiming for quick closings. |
| Median Days on Market (Active Listings) | 32 days | -28.9% | Even active listings aren't lingering, reflecting high turnover. |
| Median Days on Market (Pending Listings) | 15 days | -34.8% | Pending sales are accelerating, pointing to efficient transaction processes. |
| Months Supply of Inventory | 2.02 months | +5.2% (MoM), -5.6% (YoY) | At just over 2 months, this low inventory level confirms a strong seller's market; typically, under 3 months favors sellers heavily. |
These figures highlight a market where demand outpaces supply, leading to faster sales and stable pricing. Over the past five years (from February 2021 to 2026), charts show fluctuating but generally upward trends in prices and downward trends in days on market, with inventory hovering at low levels post-pandemic.
What Do These Trends Mean for Buyers and Sellers?
For sellers in Orange County, the February 2026 data paints an optimistic picture. With a sold-to-list price ratio nearing 100% and median days on market at historic lows (17 days for sold properties), now is an excellent time to list if you're ready to move. The slight uptick in active listings (up 5.3%) hasn't diluted the seller's advantage, as the overall months of inventory remains below 3—far from the balanced market threshold of 4-6 months.
Buyers, however, face challenges in this competitive environment. The stable median home price of $1,200,000 for single-family homes, condos, and townhouses means affordability is strained, but the increase in sales volume (up 12.8%) suggests opportunities for those who act quickly. Reduced days on market (down over 30% across categories) mean popular listings could go pending in under two weeks. To succeed, buyers should prioritize pre-approvals and work with experienced local realtors to navigate multiple-offer situations.
Looking at year-over-year trends, inventory is down 5.6%, reinforcing the long-term supply shortage driven by California's housing dynamics. This could lead to gradual price appreciation if demand holds, especially with economic factors like job growth in tech and tourism sectors bolstering the region.
Current Mortgage Rates and Affordability in Orange County
Mortgage rates play a crucial role in buyer decisions, and as of early March 2026, the national average for a 30-year fixed-rate mortgage stands at 6.15% with an APR of 6.21%. This represents a slight increase from the previous week, influenced by global uncertainties such as the ongoing Iran conflict, though rates are still near their lowest levels since September 2022.
For a hypothetical purchase of a $1,310,000 home (close to the median) with a 20% down payment ($262,000), the loan amount would be $1,048,000. At 6.15%, the estimated monthly principal and interest payment is approximately $6,385 (excluding taxes, insurance, and HOA fees). Adjustable-rate mortgages offer lower initial rates—for example, a 5/1 ARM at 5.47%—which could reduce short-term payments but come with future adjustment risks.
These rates make financing more accessible compared to peak levels in 2023-2024, potentially encouraging more buyers to enter the market. Consulting a lender for personalized quotes is recommended, especially with credit scores of 780+ qualifying for the best terms.
Outlook for Spring 2026 and Beyond
The Orange County real estate market in March 2026 remains firmly in seller's territory, with low inventory, stable high prices, and rapid sales defining the landscape. While slight increases in listings and inventory provide a glimmer of balance, the overall trends suggest continued competition. For those asking "Is now a good time to buy a house in Orange County?"—it depends on your readiness and long-term goals, but with mortgage rates stabilizing around 6%, opportunities exist for prepared buyers.
If you're considering buying or selling in Orange County, contact MacLean Realty Group for expert guidance tailored to your needs. Stay tuned for next month's update, and follow us on X @MacLeanRealty for real-time insights.