Orange County’s housing market entered October with a clear split: single-family homes continue to hold up better than condos as inventory rises and elevated mortgage rates weigh on buyer demand. September data shows the market remains tilted in favor of sellers, but the gap is narrowing. Active listings increased, closed sales dropped sharply from the prior month, and days on market lengthened—especially for condos. Meanwhile, single-family home prices stayed firm while the condo segment remained flatter. With 30-year mortgage rates hovering near 7.5%, affordability pressures are giving buyers more negotiating room even as well-priced homes continue to sell.
Active Listings: Inventory Is Rising
Active inventory across single-family + condo/townhouse/apt reached 4,794 properties in September 2026, up 2.5% month-over-month.
| Property Type | # of Active Properties | MoM Change | Median List Price | MoM Change | Median Days in RPR |
|---|---|---|---|---|---|
| Combined | 4,794 | +2.5% | $1,290,000 | -0.6% | 48 (+2.1%) |
| Single Family | 2,800 | +2% | (not separately listed in active price chart) | — | 47 (0%) |
| Condo/Townhouse/Apt | 1,994 | +3.2% | $799,844 | +0.1% | 51 (+8.5%) |
Condos are showing faster inventory growth and a bigger jump in days on market. New listings for the combined market rose 11.1% month-over-month to 2,452, indicating more sellers are testing the market heading into fall.
Pending vs. Sold vs. Active: Speed and Volume
Homes that go under contract and close still move relatively quickly, while overall active inventory is lingering longer.
- Active median days in RPR: ~47–51 days.
- Pending median days in RPR: 56 days for combined and single-family (sharp +133–167% MoM jumps). This spike suggests some contracts are taking longer or more listings are stalling in pending status.
- Sold median days in RPR: 19 days for single-family homes (+11.8% MoM) and 29 days for condos (+3.6% MoM). Combined: 23 days.
Volume comparison (September 2026):
- Active: 2,800 single-family (+2% MoM), 4,794 condo (+2.5% MoM)
- Pending: 1,222 single-family (+29% MoM), 625 condo (+28.1% MoM)
- Sold: 581 single-family (−48.4% MoM), 276 condo (−49.8% MoM)
The large month-over-month drop in closed sales is typical of the seasonal transition from summer, but it is amplified by higher borrowing costs reducing buyer activity.
Median Prices: Single-Family Holding Stronger Than Condos
Sold prices:
- Single-family median sold price: $1,475,000 (+3.1–3.15% MoM). Sold-to-list ratio remains strong at 99.2%.
- Condo median sold price: $794,500 (+1.9% MoM). Sold-to-list: 98.6%.
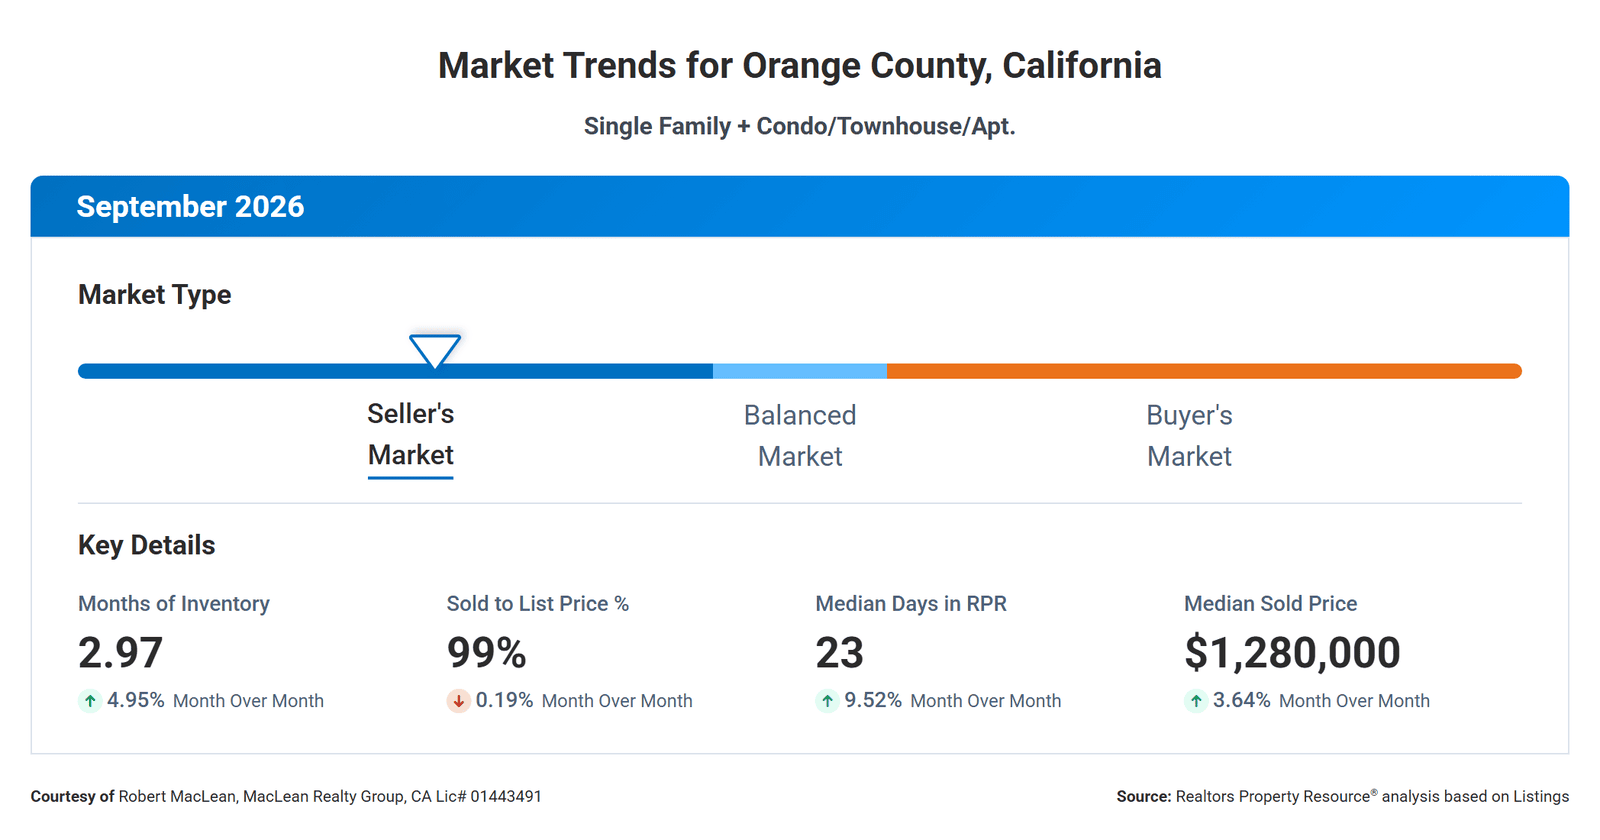
- Combined median sold: $1,280,000 (+3.6% MoM).
Estimated property values (broader market indicator):
- Single-family: $1,348,910 (0% MoM, +2.2% over the prior 12 months)
- Condo: $824,250 (−0.1% MoM, −0.3% over 12 months)
- Combined: $1,231,930 (0% MoM, +2% over 12 months)
Single-family homes continue to show modest appreciation while the condo segment has flattened or softened slightly year-over-year. Active median list prices are lower than recent sold prices for single-family homes, which is common as sellers adjust expectations.
Months of Inventory and Market Type
Both segments are still classified as seller’s markets, but inventory is climbing:
| Property Type | Months of Inventory | MoM Change | 12-Month Change | Market Type |
|---|---|---|---|---|
| Single Family | 2.64 | +4.3% | −5.4% | Seller’s |
| Condo | 3.61 | +6.2% | +12.1% | Seller’s |
| Combined | 2.97 | +4.9% | +1% | — |
Single-family inventory is tighter year-over-year. Condos have seen a more noticeable buildup in supply, giving buyers slightly more leverage in that segment.
Mortgage Rate Trends and Market Impact
As of mid-October 2026, Bankrate’s national average 30-year fixed mortgage rate is approximately 7.46–7.55%, with the 15-year fixed near 6.82%. Rates rose sharply through much of 2026 after starting the year lower (early 2026 lows near 6%), driven by persistent inflation, elevated oil prices tied to geopolitical tensions, and higher 10-year Treasury yields (recently above 5.3% at points).
Higher rates reduce purchasing power, slow buyer urgency, and contribute to longer days on market for active listings while supporting only modest price growth. Many homeowners remain “rate-locked” with lower-rate mortgages from prior years, limiting new supply of well-priced homes. Experts generally expect rates to remain elevated (“higher for longer”) into 2027, which should keep demand restrained and inventory from collapsing.
Conclusions: What the Data Says
Orange County’s September 2026 market shows a classic late-summer/early-fall transition amplified by higher mortgage rates. Single-family homes remain the stronger, tighter segment with better price support and faster sales for properties that are correctly priced. Condos are softer, with rising inventory, longer active days on market, and flatter values.
For sellers: Price realistically relative to recent comps. Homes that sell still move in under three weeks in many cases (especially single-family), but overpriced listings sit longer. Strong sold-to-list ratios indicate well-prepared, well-priced homes continue to attract buyers.
For buyers: More inventory (especially condos) and longer active market times create better negotiating room than in prior years. However, elevated rates mean monthly payments remain high, so focusing on total affordability and long-term equity is key. Single-family homes are more competitive.
Overall, the market is cooling from peak tightness but is far from a buyer’s market. Price declines remain limited because inventory, while rising, is still historically constrained relative to pre-pandemic levels, and demand for quality Orange County housing persists.
Frequently Asked Questions
What is the median home price in Orange County right now?
In September 2026, the median sold price was $1,475,000 for single-family homes and $794,500 for condos/townhomes. The combined median sold price was $1,280,000.
Is Orange County a buyer’s or seller’s market?
It remains a seller’s market for both single-family homes (2.64 months of inventory) and condos (3.61 months), though inventory is rising and buyers have more options than in recent peak years.
How long are homes taking to sell in Orange County?
Active listings average roughly 47–51 days. Homes that sell do so faster—median 19 days for single-family sold properties and 29 days for condos.
How are mortgage rates affecting the Orange County market?
Rates near 7.5% are reducing buyer purchasing power and contributing to slower sales volume and longer days on market for active listings, while price appreciation has moderated to low single digits year-over-year for single-family homes.