
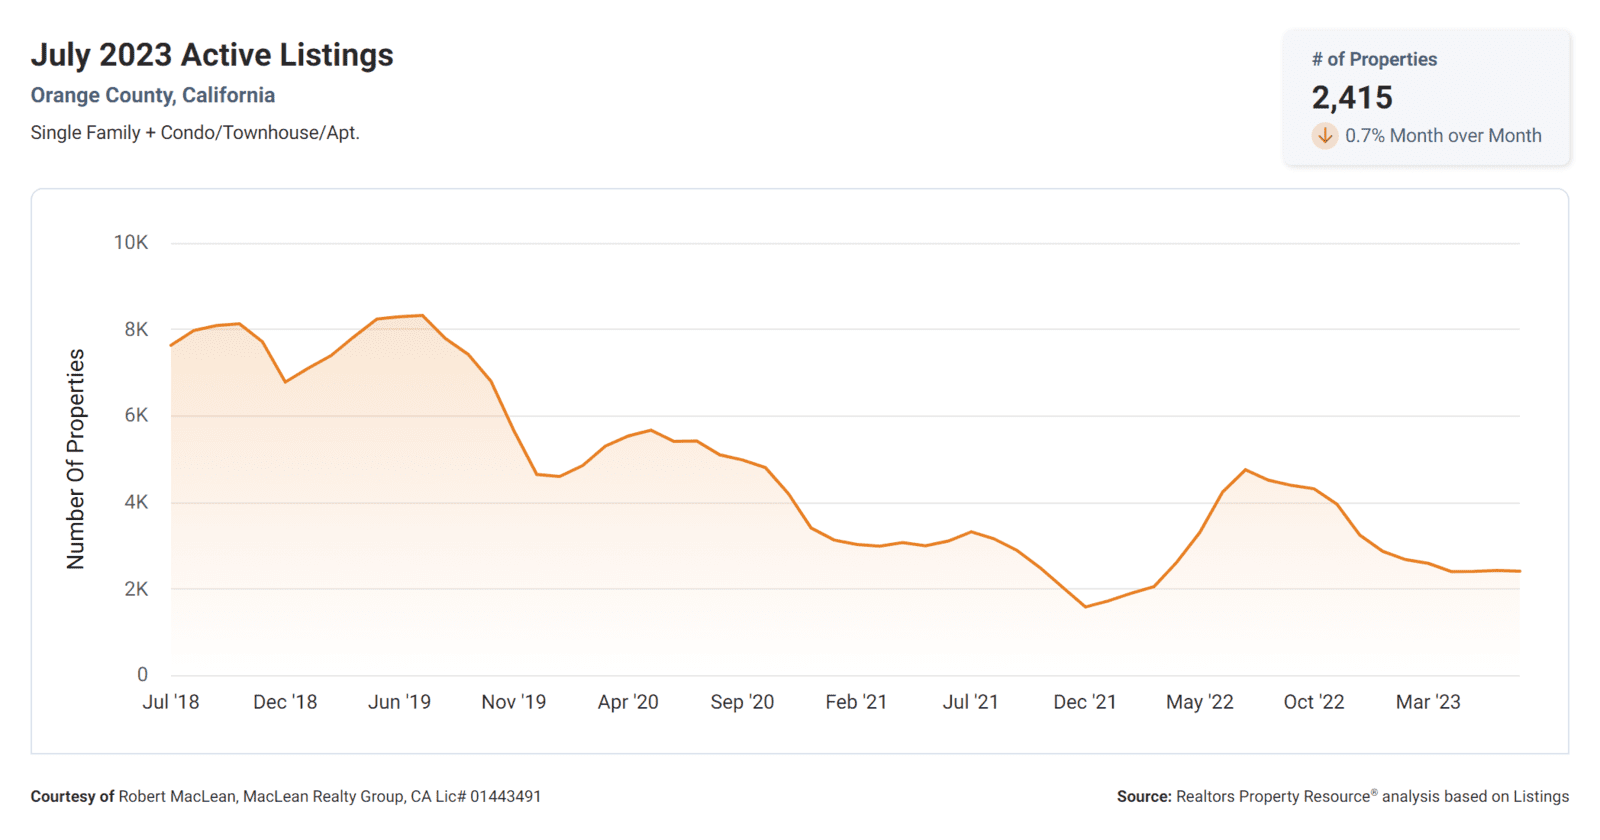
Still High Housing Demand and Low Supply
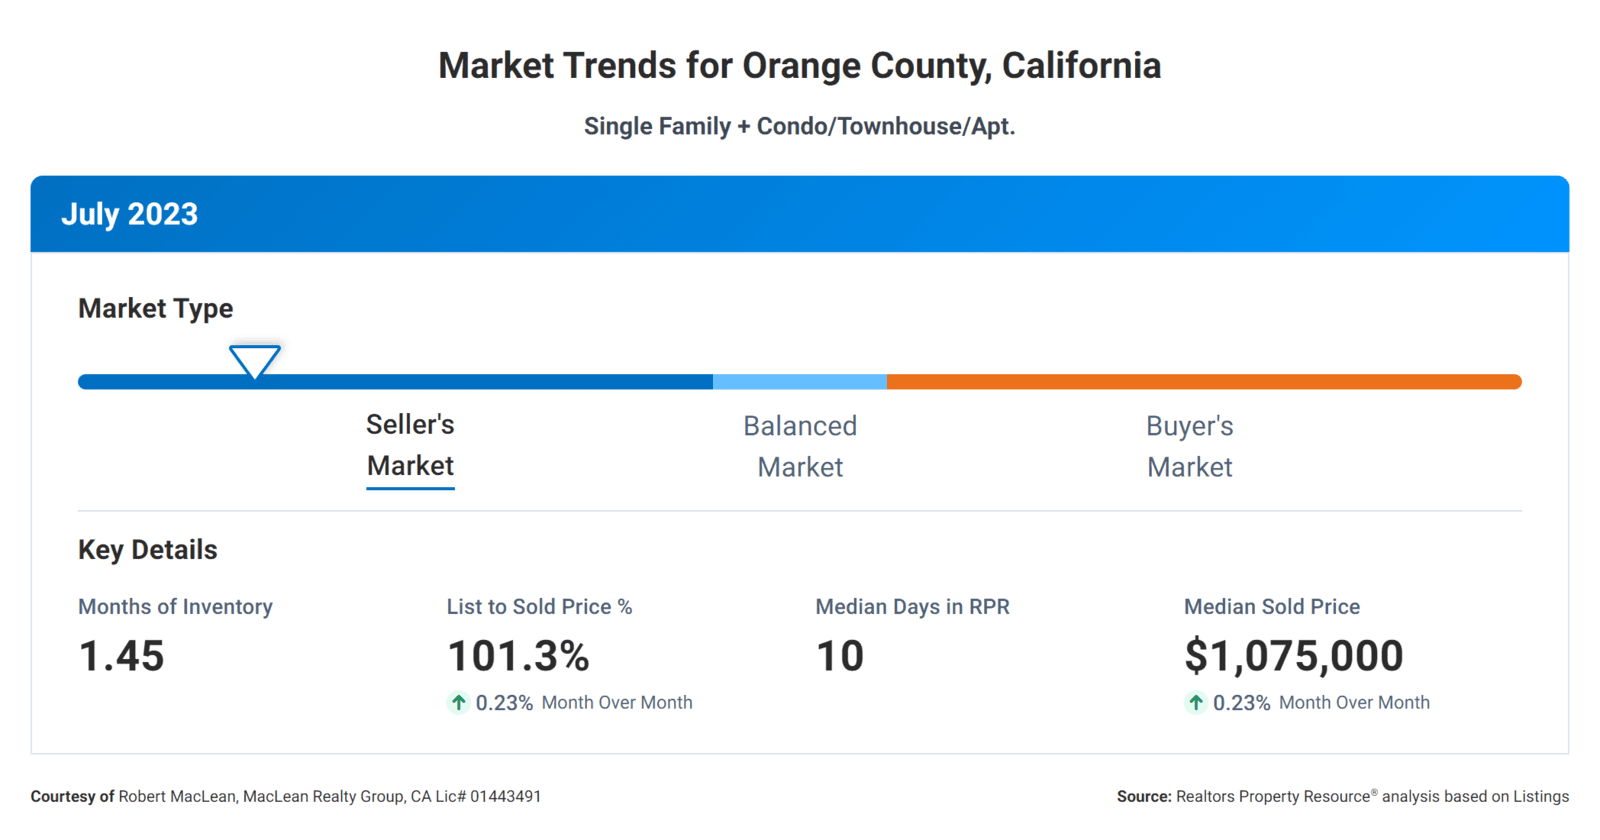
First, let's take a look at the Months Supply of Inventory, which currently stands at 1.45. This metric represents the number of months it would take for the current inventory of homes on the market to be sold, given the current sales pace. A lower number indicates a limited supply of homes, which often results in increased competition among buyers. As a result, sellers may have more leverage in negotiating prices and terms. For a balanced market we would like to see something closer to 6 months of inventory. Currently today we are seeing about half of the normal inventory of homes for sale that we were used to seeing in years past.
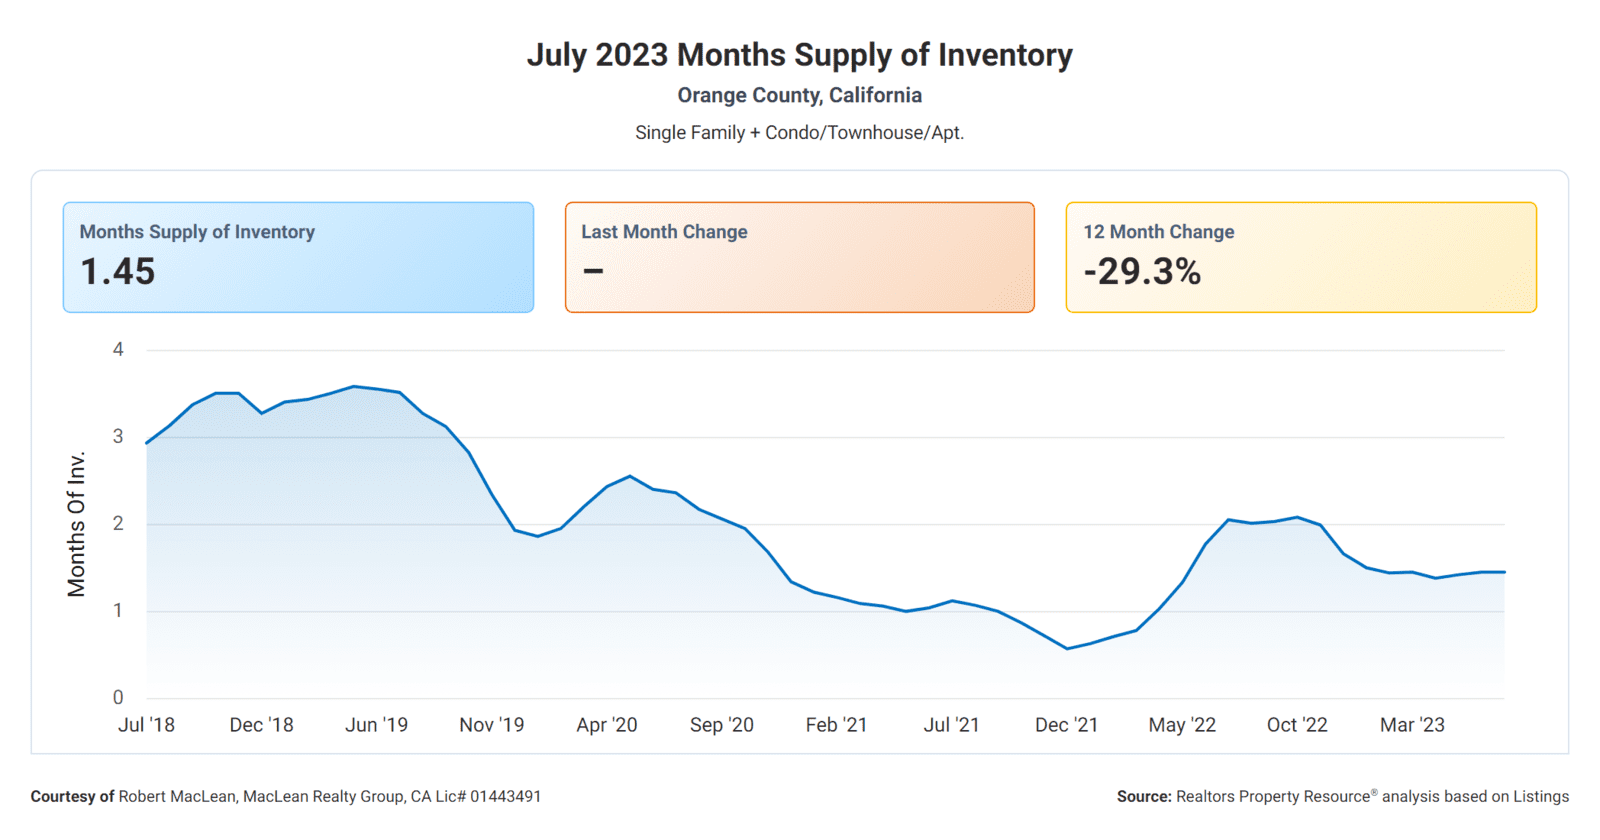
As you can see the 12-Month Change in Months of Inventory is -29.3%. This figure represents the percentage change in the number of months it would take to sell the current inventory compared to the same time period last year. A negative value suggests a decrease in the time it takes to sell homes, implying a more active and fast-paced market. This can be beneficial for sellers as their properties are likely to spend less time on the market.
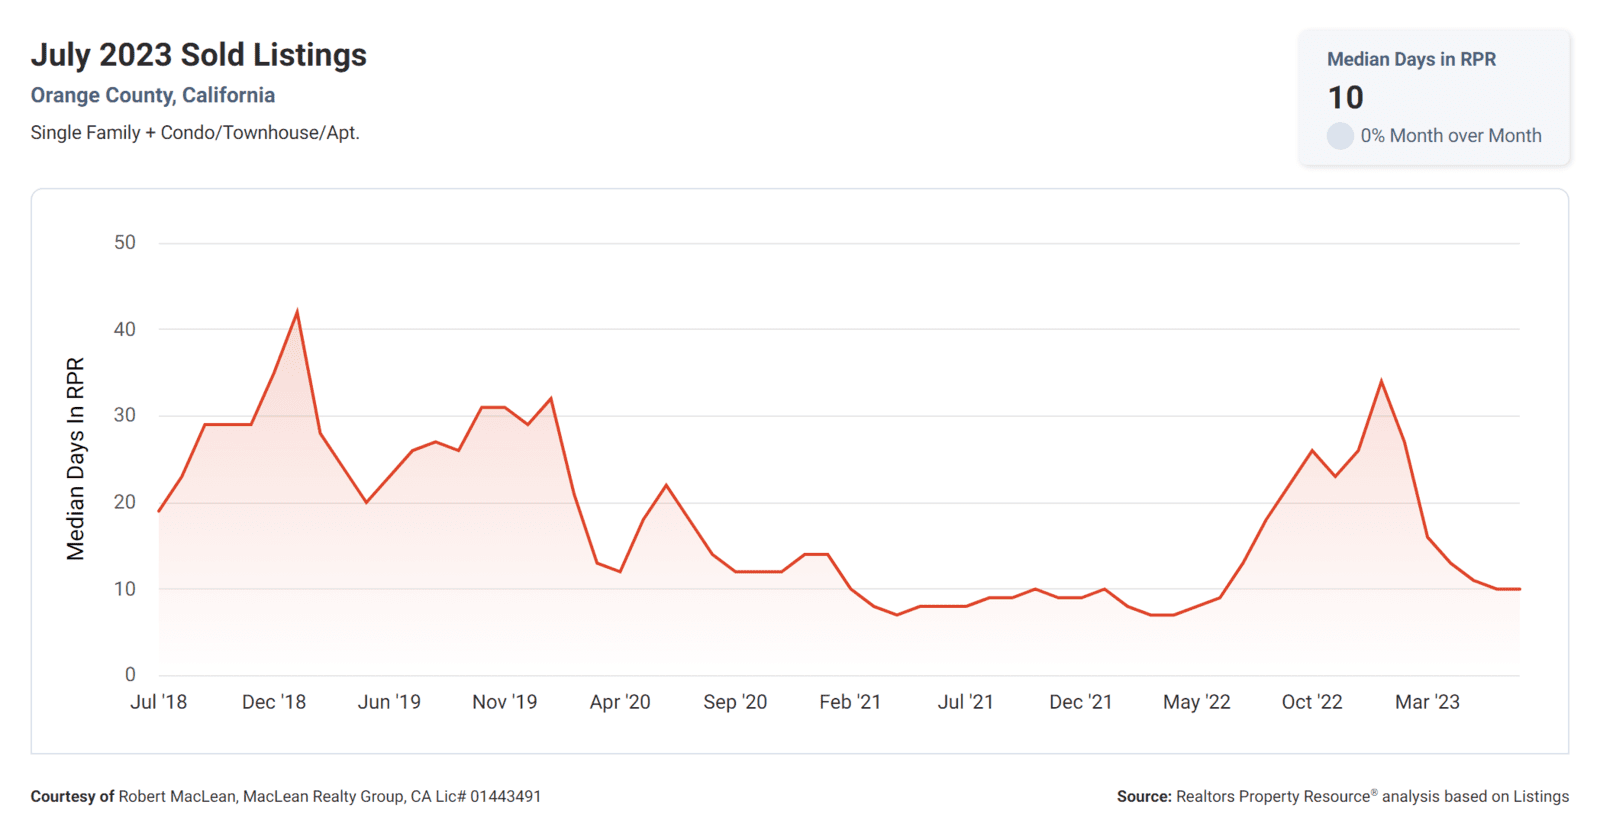
Another critical metric to consider is the Median Days Homes are On the Market, which currently stands at a low of 10 days. This figure represents the median number of days it takes for a property to go under contract after being listed. A lower number indicates a faster-moving market, where homes are in high demand. This is great news for sellers, as it suggests that their properties are attracting buyers quickly.
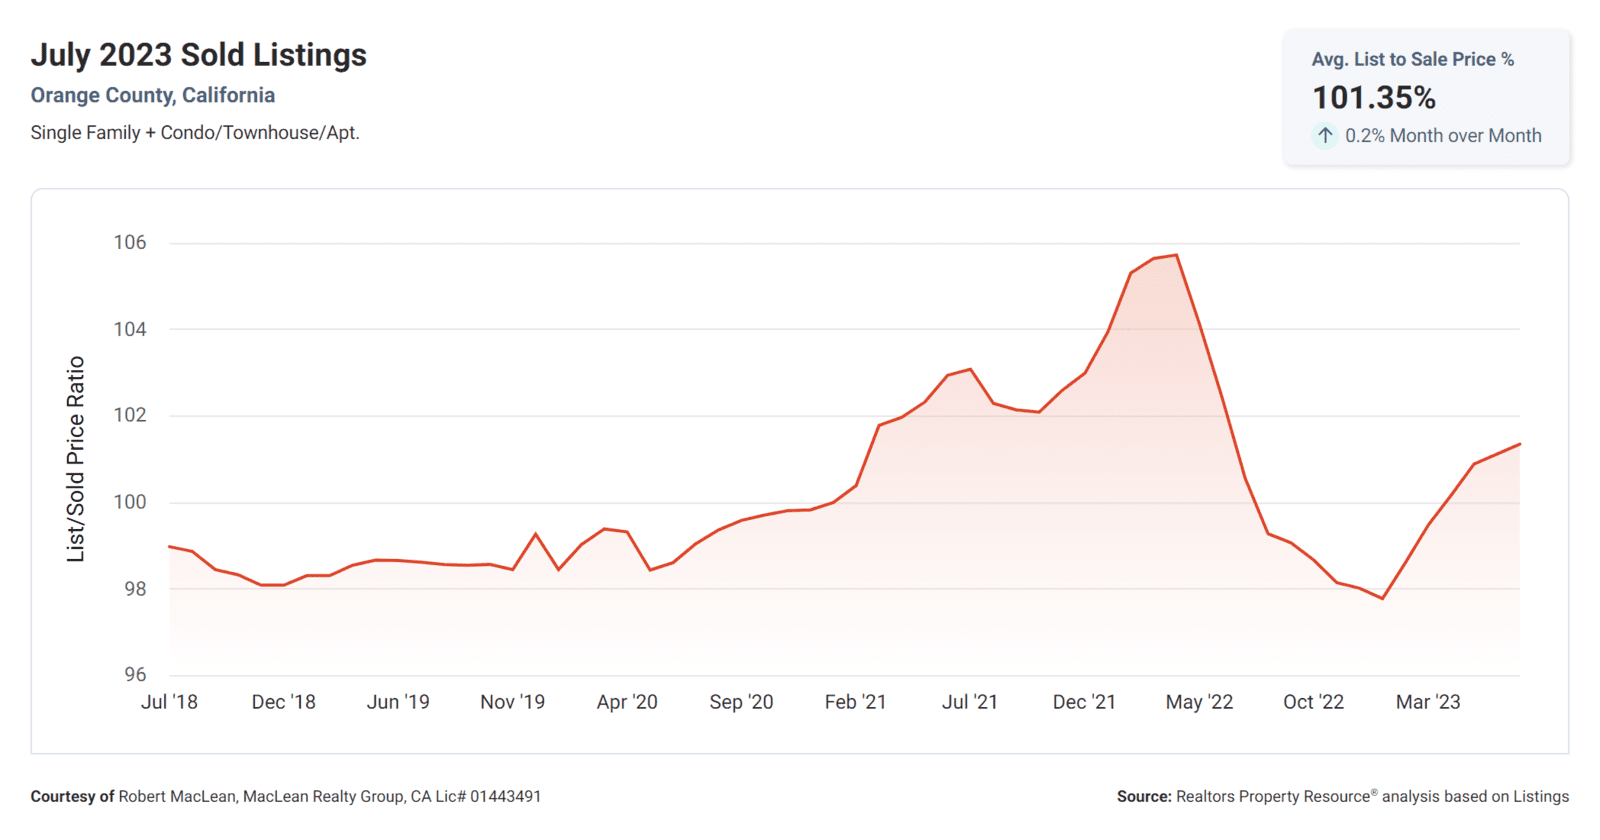
Now, let's look into the List to Sold Price Percentage, which stands at 101.35%. This metric represents the percentage of the listed price that the property ultimately sells for. A value above 100% indicates that, on average, homes are selling for more than their initial listing price. This suggests a competitive market where buyers are willing to pay a premium to secure their desired property. For sellers, this means they have a higher chance of achieving their asking price or even exceeding it.
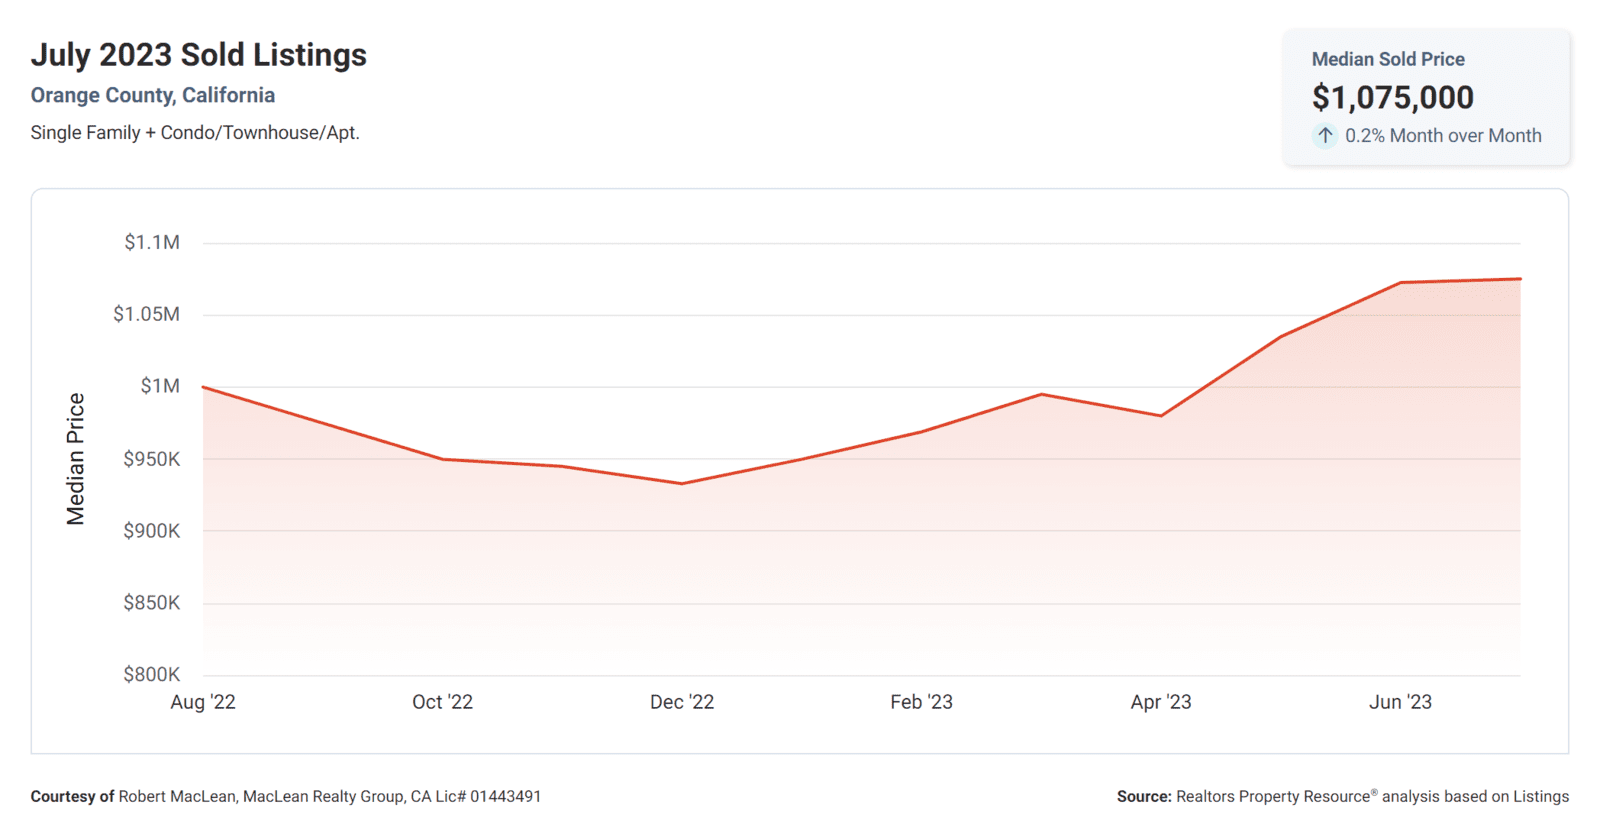
Then we have the Median Sold Price, which currently stands at a $1,075,000. This metric represents the middle point of all the sold prices within a given timeframe. This figure provides an indication of the overall price range in the market. A higher median sold price suggests a market with higher-priced properties, which can be advantageous for sellers looking to maximize their returns.
As you can see below the Median Sales Price has also increased 7.5% year over year. Last year at this time the Median Sold Price was $1,000,000.
We have seen a clear correlation between these real estate metrics. The low Months Supply of Inventory, combined with a significant decrease in the 12-Month Change in Months of Inventory, indicates a market with limited supply and high demand. This is further supported by the incredibly low Median Days Homes are On the Market, suggesting a fast-paced and competitive environment.
Furthermore, the List to Sold Price Percentage above 100% highlights the willingness of buyers to pay a premium for properties, resulting in sellers being able to achieve or exceed their desired prices. Finally, the high Median Sold Price indicates a market with higher-priced properties, potentially benefiting sellers who are looking to maximize their returns.
Mortgage Rates
The average rate on 30-year mortgages reached 7.12 percent, up from 7.09 percent last week, according to Bankrate’s weekly national survey of large lenders. That reading matched the October 2022 peak of 7.12 percent. The last time rates were higher was April 2002, according to Bankrate data. Here is a great article that talks about the state of mortgage rates today and what the future holds for them. The historical average mortgage rate since the 70's in between 6 and 7 percent.
Conclusion
As buyers and sellers, it is crucial to be aware of these trends and understand how they can impact your decisions in the real estate market. Whether you are looking to purchase or sell a property, these insights can help guide your strategy and ensure that you make informed decisions based on the current market conditions.